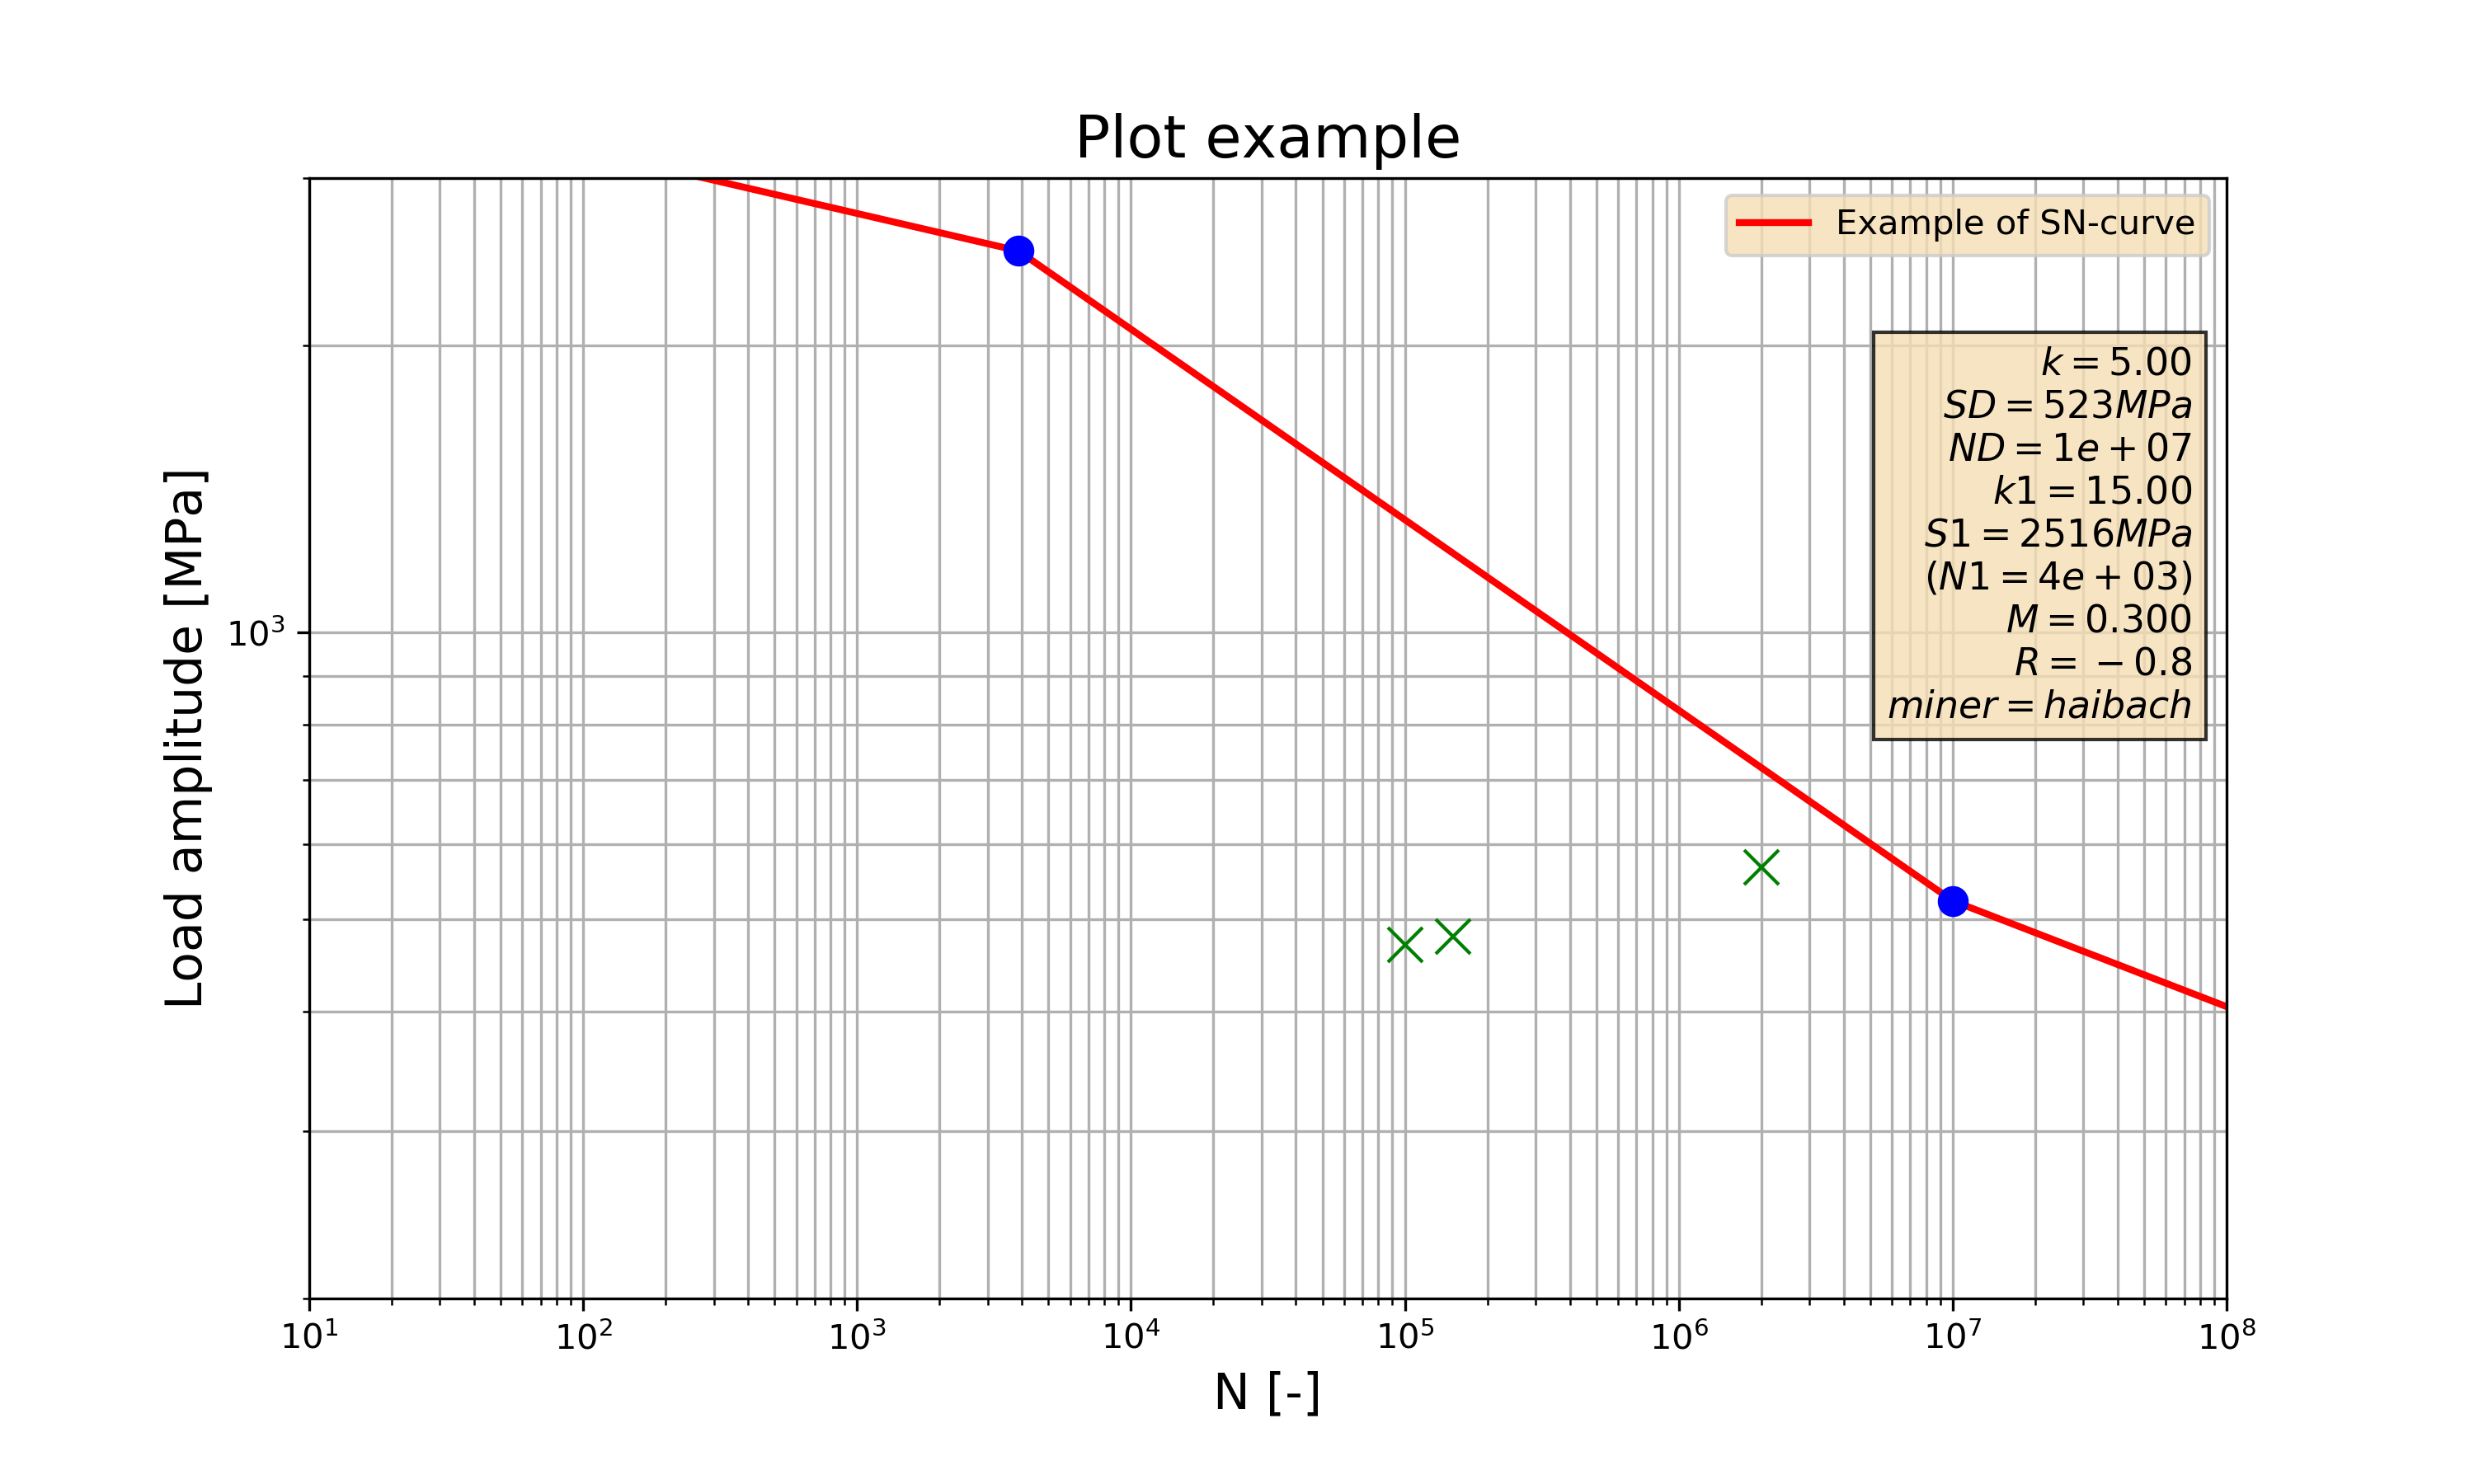
Code example
first do some imports
from matplotlib import pyplot as plt
import numpy as np

from stress_life import SN_curve
define the SN curve
sn = SN_curve.SN_Curve(k=5, ND=1e6, SD=500, k1=15, S1=2000, M=0.3, R=0)

# print the SN parameters for checking
print(sn)

#SD............. 500.00
#ND............. 1000000.00
#k.............. 5.00
#S1............. 2000.00
#N1............. 976.56
#k1............. 15.00
#miner.......... haibach
#R.............. 0.00
#M.............. 0.30
#meanCorrType... fkm
apply some SN modification methods if needed
sn.shift_ND(1e7)
sn.transform_to_R(R=-0.8)
sn.SD = 523

# check the modified SN parameters again
print(sn)

#SD............. 523.00
#ND............. 10000000.00
#k.............. 5.00
#S1............. 2516.13
#N1............. 3880.11
#k1............. 15.00
#miner.......... haibach
#R.............. -0.80
#M.............. 0.30
#meanCorrType... fkm
create a load and compute the damage
load = np.array([[-600,500,100000,1.1],
                 [0, 800, 150000, 1.05],
                 [-800, 200, 2e6, 0.7]])
res = sn.compute_D_l1_l2(load, excel_out="example.xlsx")
print(res)

#   lower_load  upper_load   mean    amp    R  amp_R=-1  amp_R=R_SN  \
#0      -600.0       500.0  -50.0  550.0 -1.2     535.0  517.741935
#1         0.0       800.0  400.0  400.0  0.0     520.0  503.225806
#2      -800.0       200.0 -300.0  500.0 -4.0     410.0  396.774194
#
#   req_cycles  shift_factor         D
#0    100000.0          1.10  0.003872
#1    150000.0          1.05  0.006835
#2   2000000.0          0.70  0.299053
visualize with matplotlib
fig, ax = plt.subplots(figsize=(10,6))

# axes labels
ax.set_title("Plot example", fontsize="xx-large")
ax.set_xlabel("N [-]", fontsize="x-large")
ax.set_ylabel("Load amplitude [MPa]", fontsize="x-large")

# SN plot
ax.plot(sn.sn_points.N, sn.sn_points.a, "r-", label="Example of SN-curve", linewidth=2.0)
ax.plot((sn.ND, sn.N1), (sn.SD, sn.S1),"ob",markersize=8)

ax.plot(res["req_cycles"], res["amp_R=R_SN"]/res["shift_factor"], "xg", markersize=10)

# SN properties
textstr = '\n'.join([
            r'$k={k:.2f}$'.format(**sn.sn_parms),
            r'$SD={SD:.0f} MPa$'.format(**sn.sn_parms),
            r'$ND={ND:.0e}$'.format(**sn.sn_parms),
            r'$k1={k1:.2f}$'.format(**sn.sn_parms),
            r'$S1={S1:.0f} MPa$'.format(**sn.sn_parms),
            r'$(N1={N1:.0e})$'.format(**sn.sn_parms),
            r'$M={M:.3f}$'.format(**sn.sn_parms),
            r'$R={R:.1}$'.format(**sn.sn_parms),
            r'$miner={miner}$'.format(**sn.sn_parms)
])

props = dict(alpha=0.8, facecolor='wheat')
ax.text(0.982, 0.85, textstr, transform=ax.transAxes, fontsize=11,
        va='top', ha="right", bbox=props)

# grids and axis settings
ax.yaxis.grid(which="both")
ax.xaxis.grid(which="both")

ax.set_xscale("log")
ax.set_yscale("log")

ax.set_ylim((200, 3000))
ax.set_xlim((10, 1e8))

leg=ax.legend(facecolor='wheat')

# visualisation
plt.savefig("SN_example.png", dpi=300)
plt.show()
